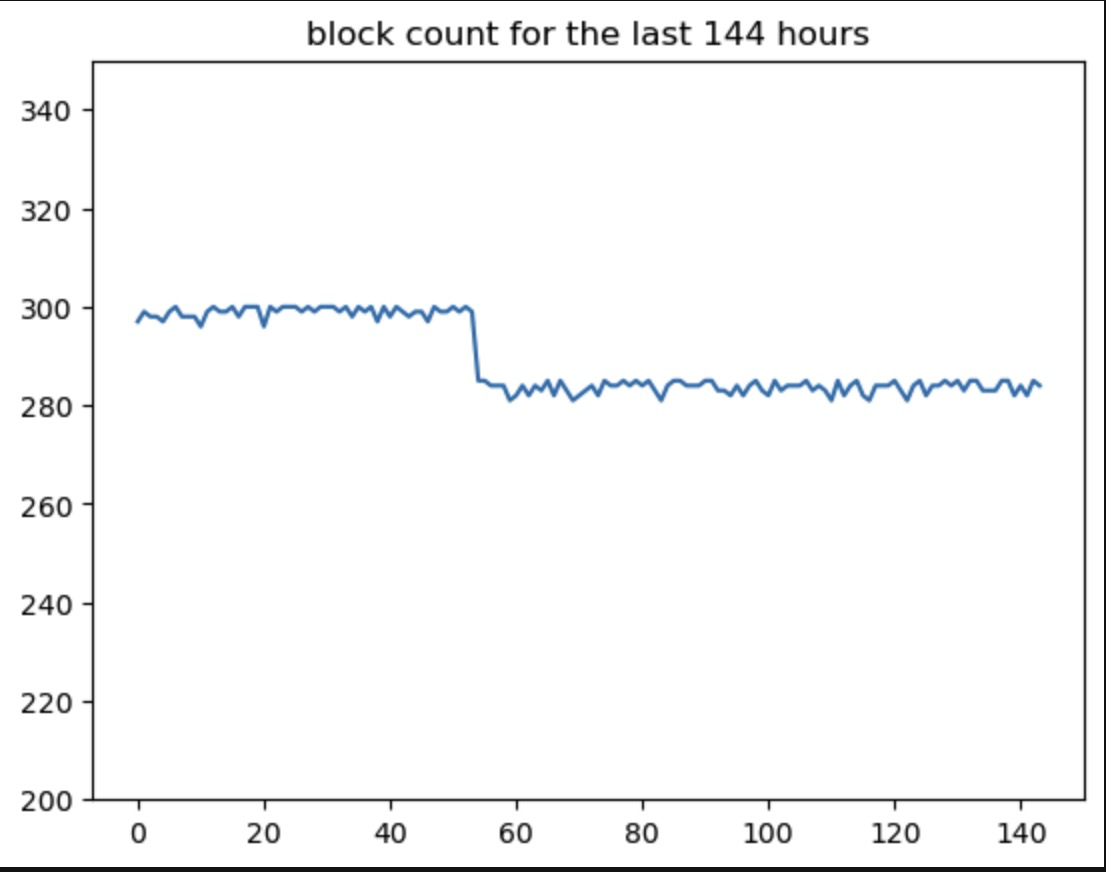
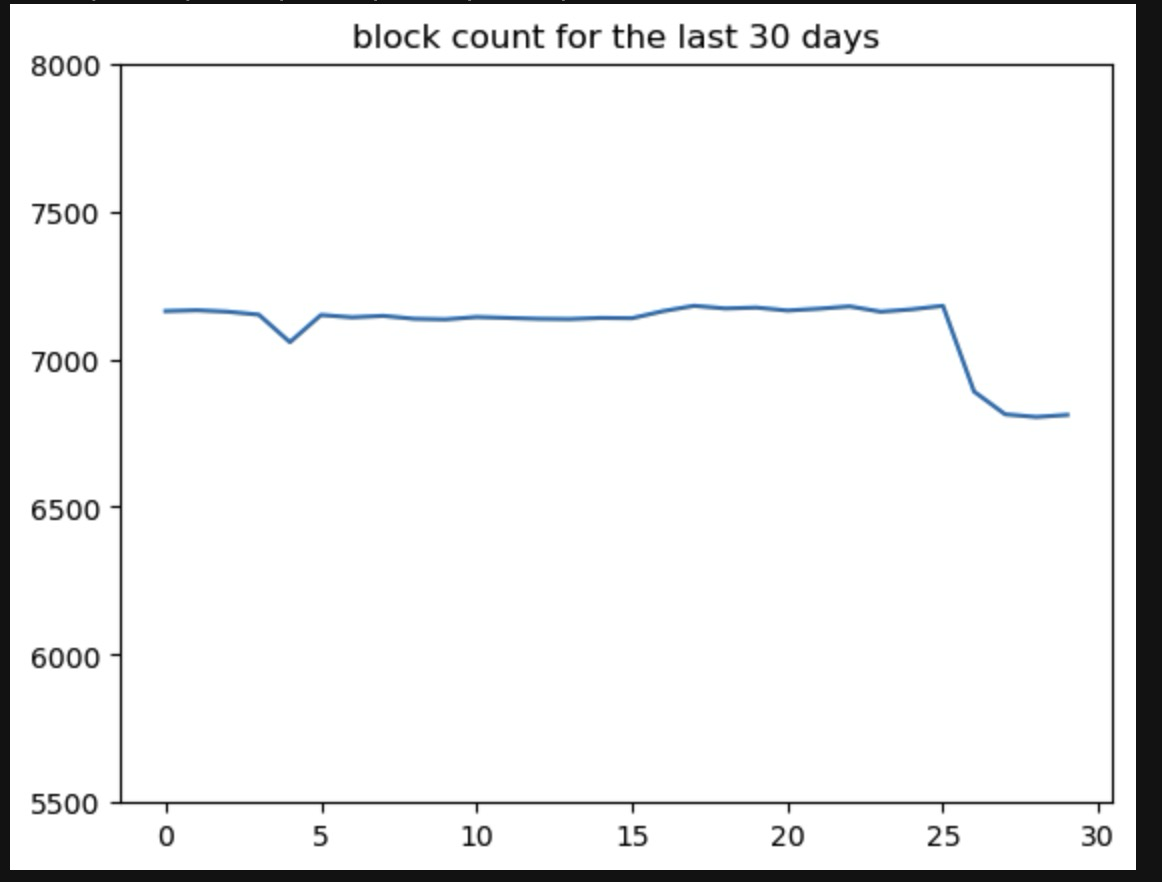
Blocks emitted over a time period
The Bittensor chain stives to emit 1 block every 12 seconds. However, chain congestion can slow down block emission. In this tutorial, we chart the number of blocks over a period of time - hours or days.
At 12 blocks/s, we should see ~300 blocks per hour, or ~7200 blocks per day. By creating a chart of the blocks per day, we can see that there is a potential congestion problem that has arisen in the last few days.
Creating the charts
Section titled “Creating the charts”We start off importing our libraries and setting parameters. In the sample below, I have 30 days as the parameters. The 2nd chart above used 144 hours.
import requests, jsonimport matplotlib.pyplot as plt
from datetime import datetime, timedelta
#parameters#allowed days or hoursscale = "days"number_of_points = 30We define our API key and 2 functions to handle date formatting (this demo was created on a beta version of taostats, and this is unlikely needed in prod)
api_key="your_api_key"

#datetime formattingdef format_string_into_datetime(dt):    format = ["%Y-%m-%dT%H:%M:%SZ","%Y-%m-%dT%H:%M:%S.%fZ"]    for fmt in formats:        try:            return datetime.strptime(dt, fmt)        except ValueError:            continue    raise ValueError("None of the formats matched the datetime object")def format_datetime_into_string(dt):    format = ["%Y-%m-%dT%H:%M:%SZ","%Y-%m-%dT%H:%M:%S.%fZ"]    for fmt in formats:        try:            return dt.strftime(fmt)        except ValueError:            continue    raise ValueError("None of the formats matched the datetime object")
We make our first API call to get the current block, and extract the timestamp.
#get current blockurl = f"https://beta-api.taostats.io/api/v1/block?limit=1"headers = {"accept": "application/json", "authorization":api_key}response = requests.get(url, headers=headers)resJson = json.loads(response.text)#print(resJson)current_block = resJson['blocks'][0]['block_number']current_block_timestamp = resJson['blocks'][0]['timestamp']# Convert the string timestamps to datetime objectsprint(current_block_timestamp)
block_time = format_string_into_datetime(current_block_timestamp)
Now we can loop over the day_counter and find the blocks hours or days ago, abd build an array of these blocks. This API call finds the time - and then looks for blocks over a 1 minute time range to ensure that there is a block in the data.
blocks = []day_counter =0while day_counter < number_of_points:
#oldest day is number_of_days - day_counter days_ago = number_of_points - day_counter
if scale =="days": day_max = block_time-timedelta(days=days_ago) else: day_max = block_time-timedelta(hours=days_ago)
day_min =day_max -timedelta(minutes=1)
day_max= format_datetime_into_string(day_max) day_min= format_datetime_into_string(day_min)
#print(day_max) #get block closest to day_max url = f"https://beta-api.taostats.io/api/v1/block?timestamp_start={day_min}×tamp_end={day_max}&limit=1" headers = {"accept": "application/json", "authorization":api_key} response = requests.get(url, headers=headers) resJson = json.loads(response.text) #print(resJson) day_block = resJson['blocks'][0]['block_number'] blocks.append(day_block)
day_counter +=1
#add the current blockblocks.append(current_block)
#Now that we have all the block numbers, we can calculate the difference, which will tell us how many blocks were emitted over each timeframe:
#now get the differenceblock_delta = []i=0while i< len(blocks)-1:    delta = blocks[i+1] - blocks[i]    block_delta.append(delta)    i+=1
print(block_delta)
And finally, let’s chart the data: